Where are we now?
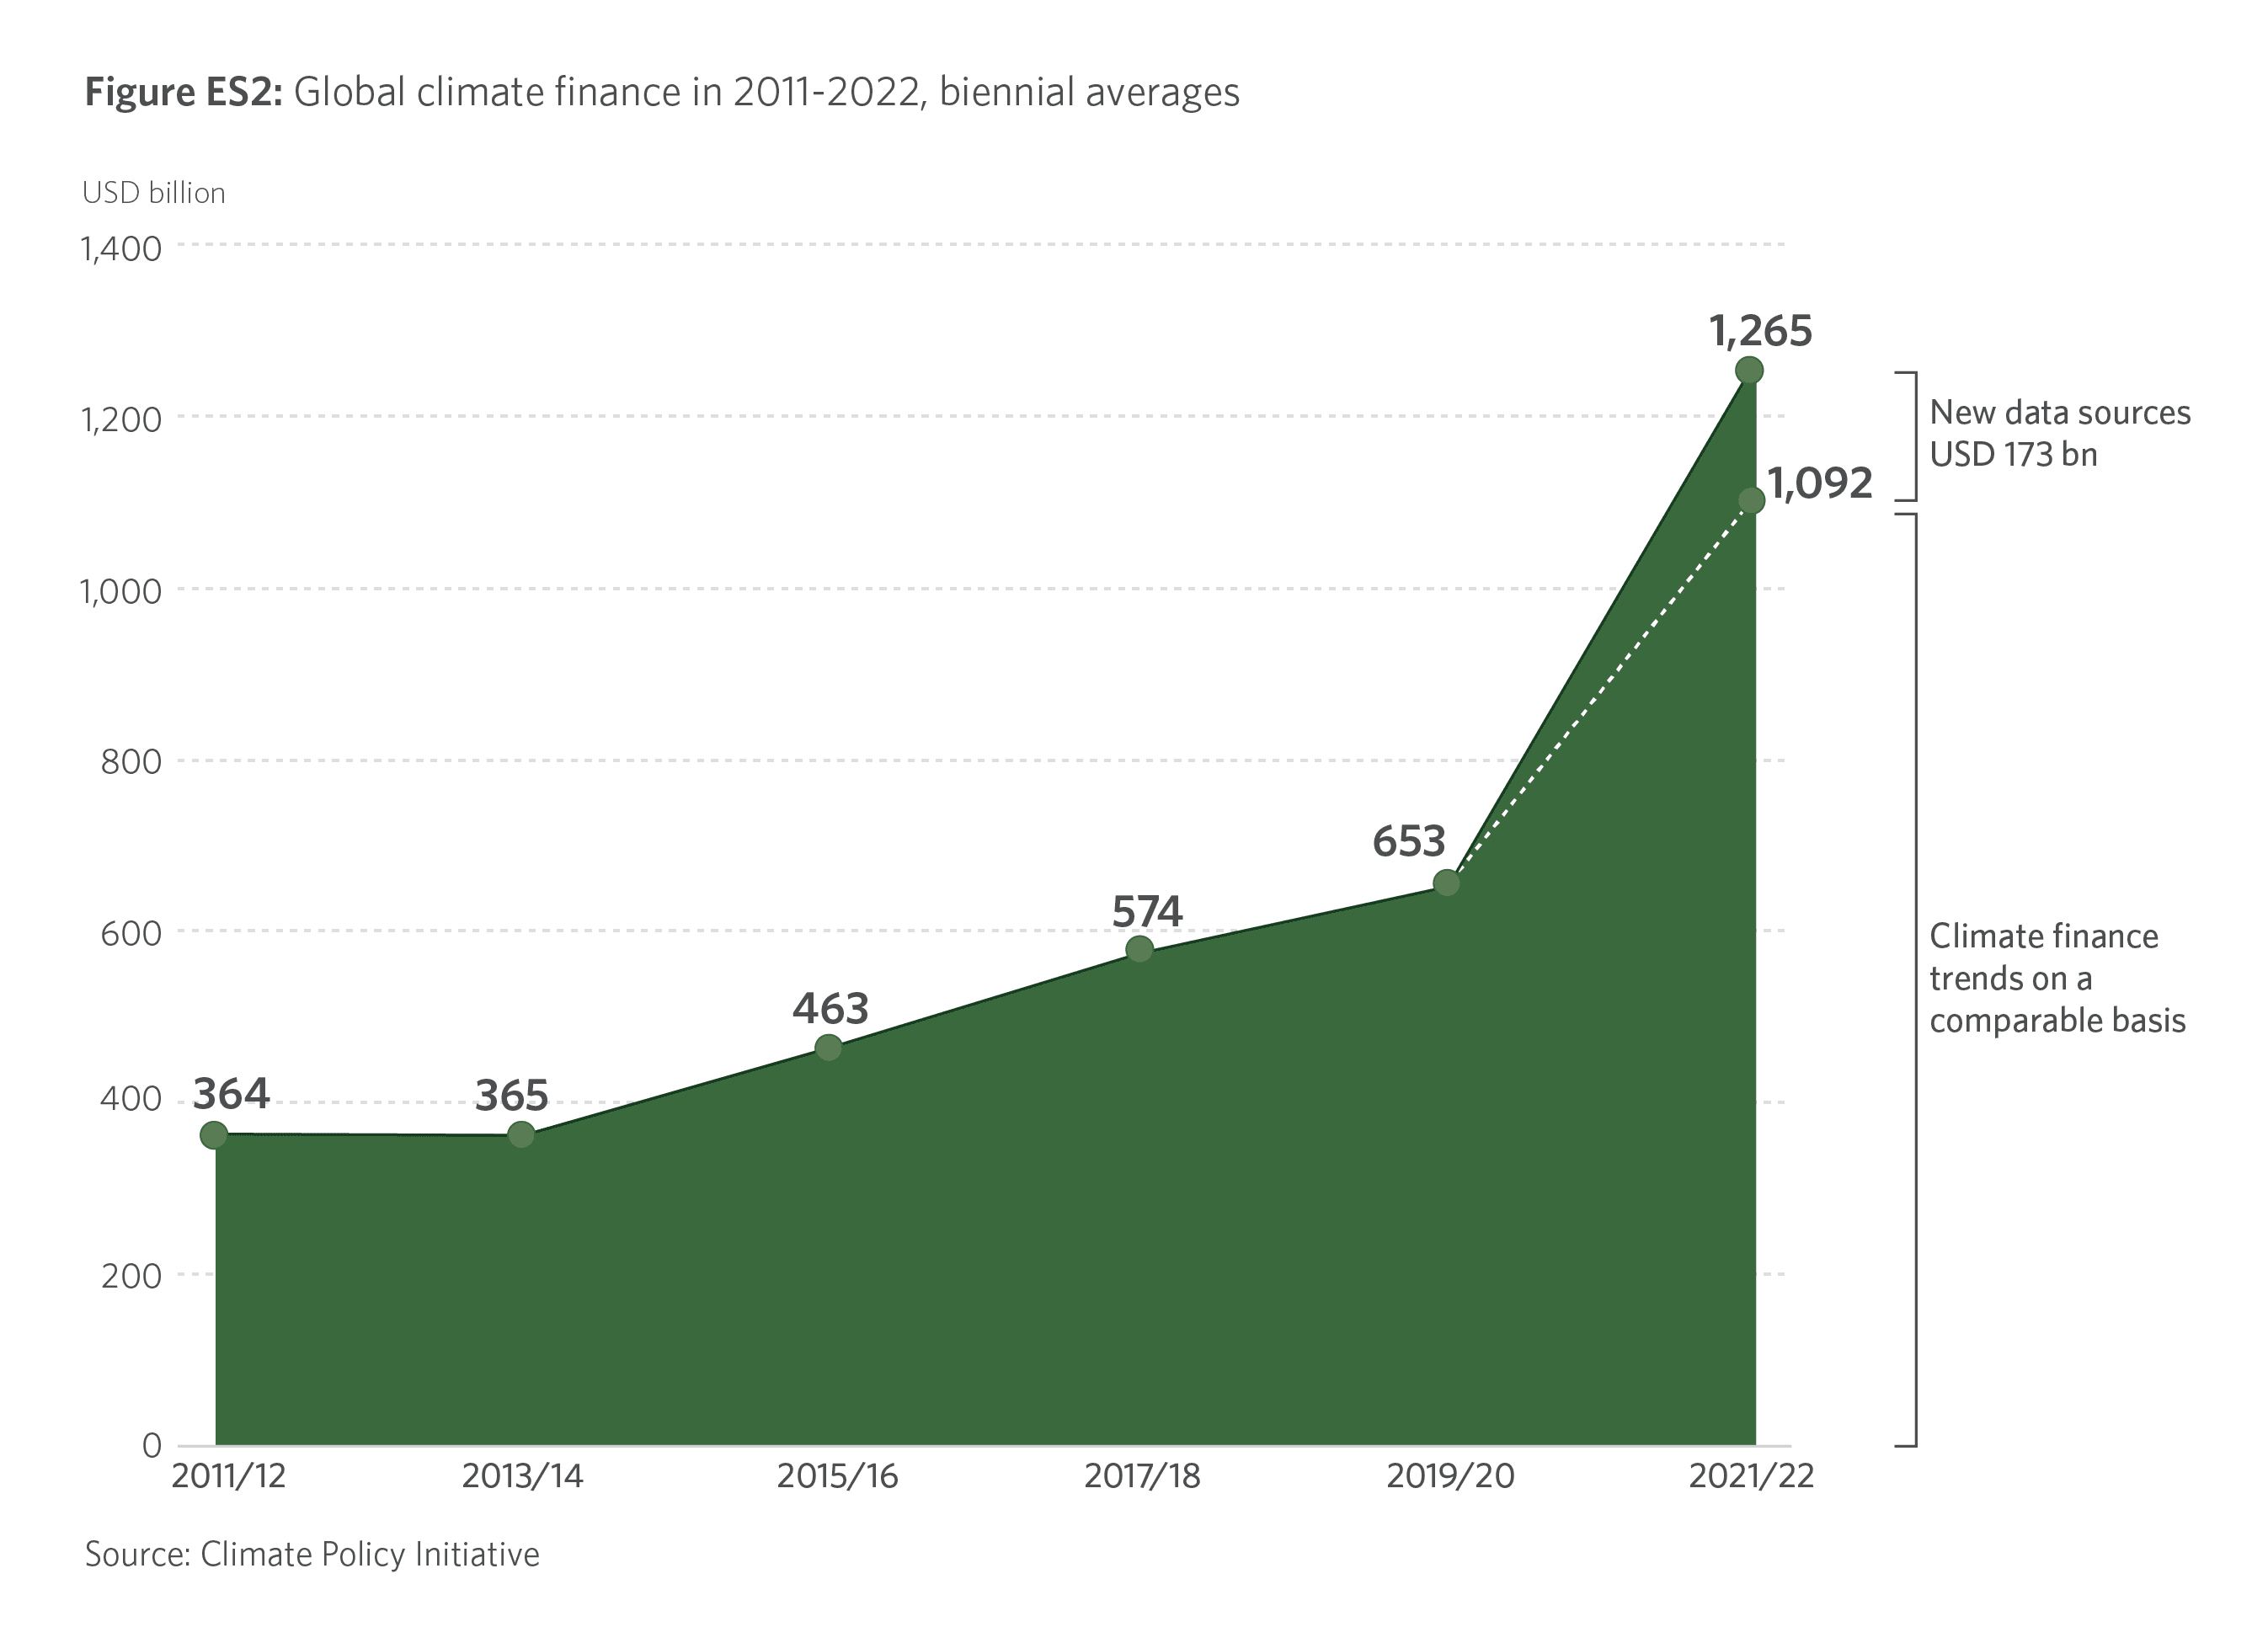
Average annual climate finance flows reached almost USD 1.3 trillion in 2021/2022, nearly doubling compared to 2019/2020 levels. This increase was primarily driven by a significant acceleration in mitigation finance (up by USD 439 billion from 2019/2020). The remainder of the growth observed in 2021/2022 (USD 173 billion each year) stems from methodological
improvements and new data sources, which augment the flows tracked in 2019/2020. Without these data improvements, annual finance flows in 2021/2022 would have amounted to just below USD 1.1 trillion.
Despite the growth in 2021/2022, current flows represent about only 1% of global GDP.
Where are we headed?
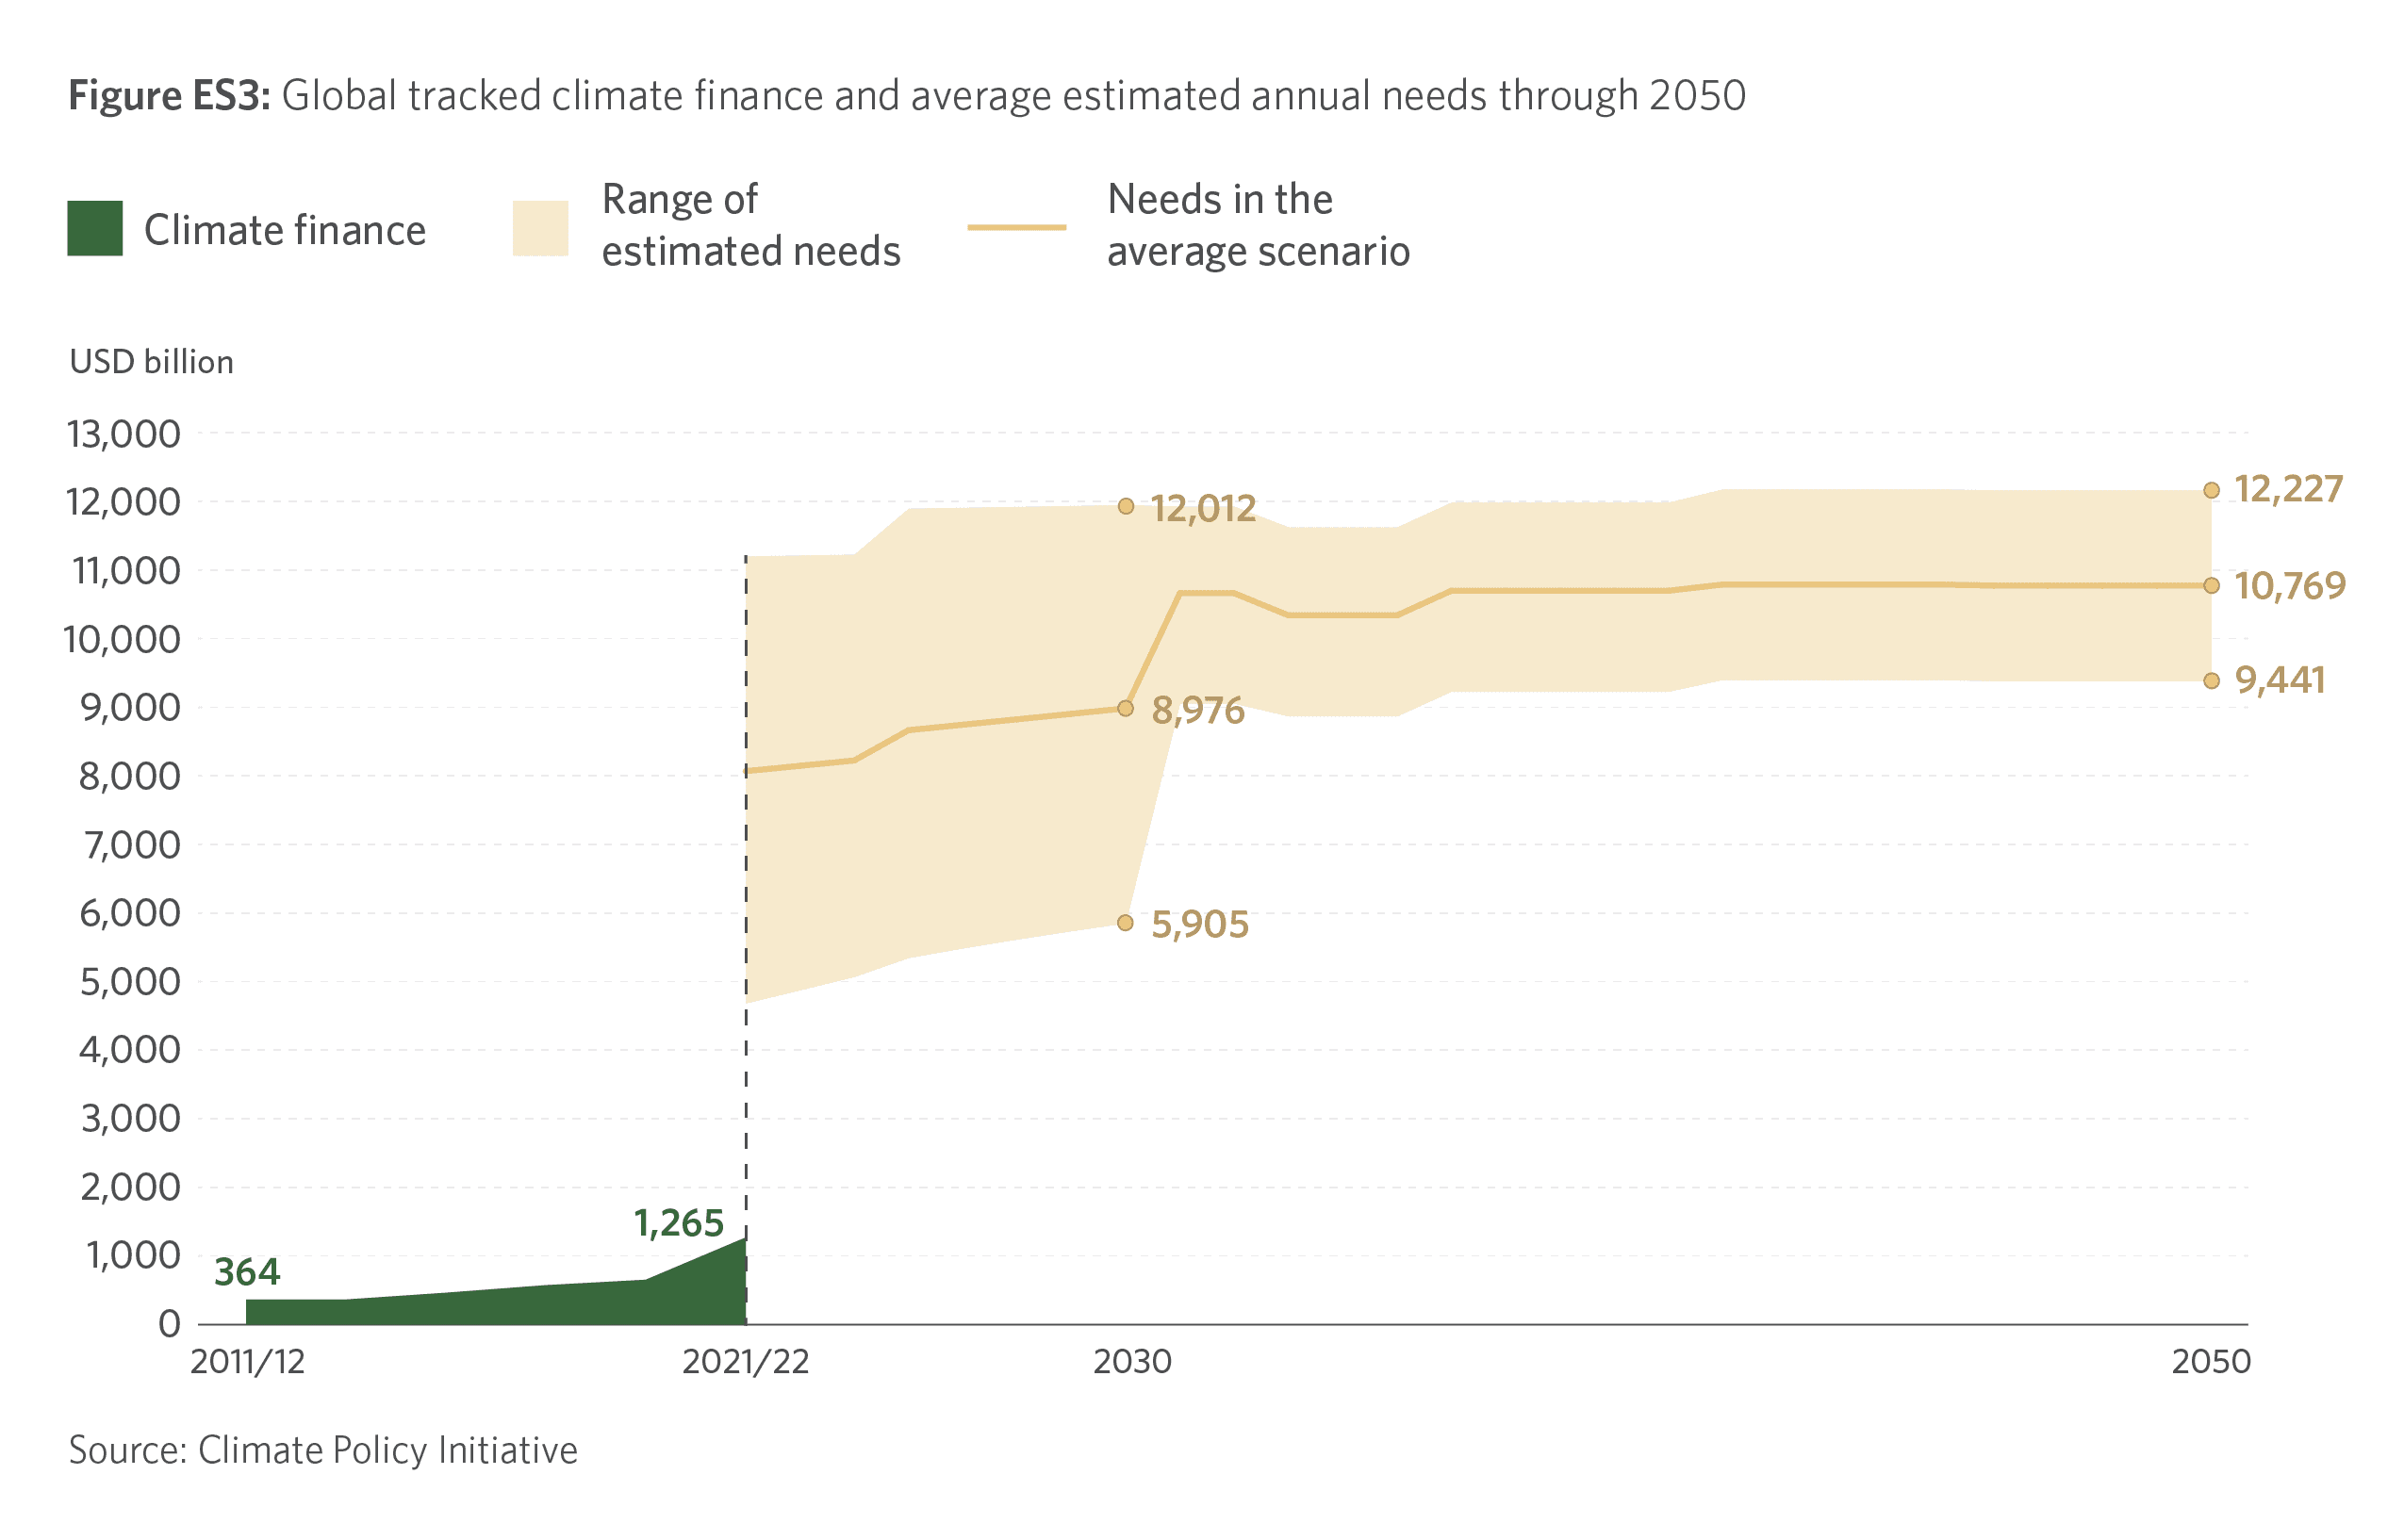
In the average scenario, the annual climate finance needed through 2030 increases steadily from $8.1 to $9 trillion. Then, estimated needs jump to over $10 trillion each year from 2031 to 2050. This means that climate finance must increase by at least five-fold annually, as quickly as possible, to avoid the worst impacts of climate change.
The cost of inaction
The longer we delay meeting total climate investment needs, the higher the costs will be, both to mitigate global temperature rise and to deal with its impacts.
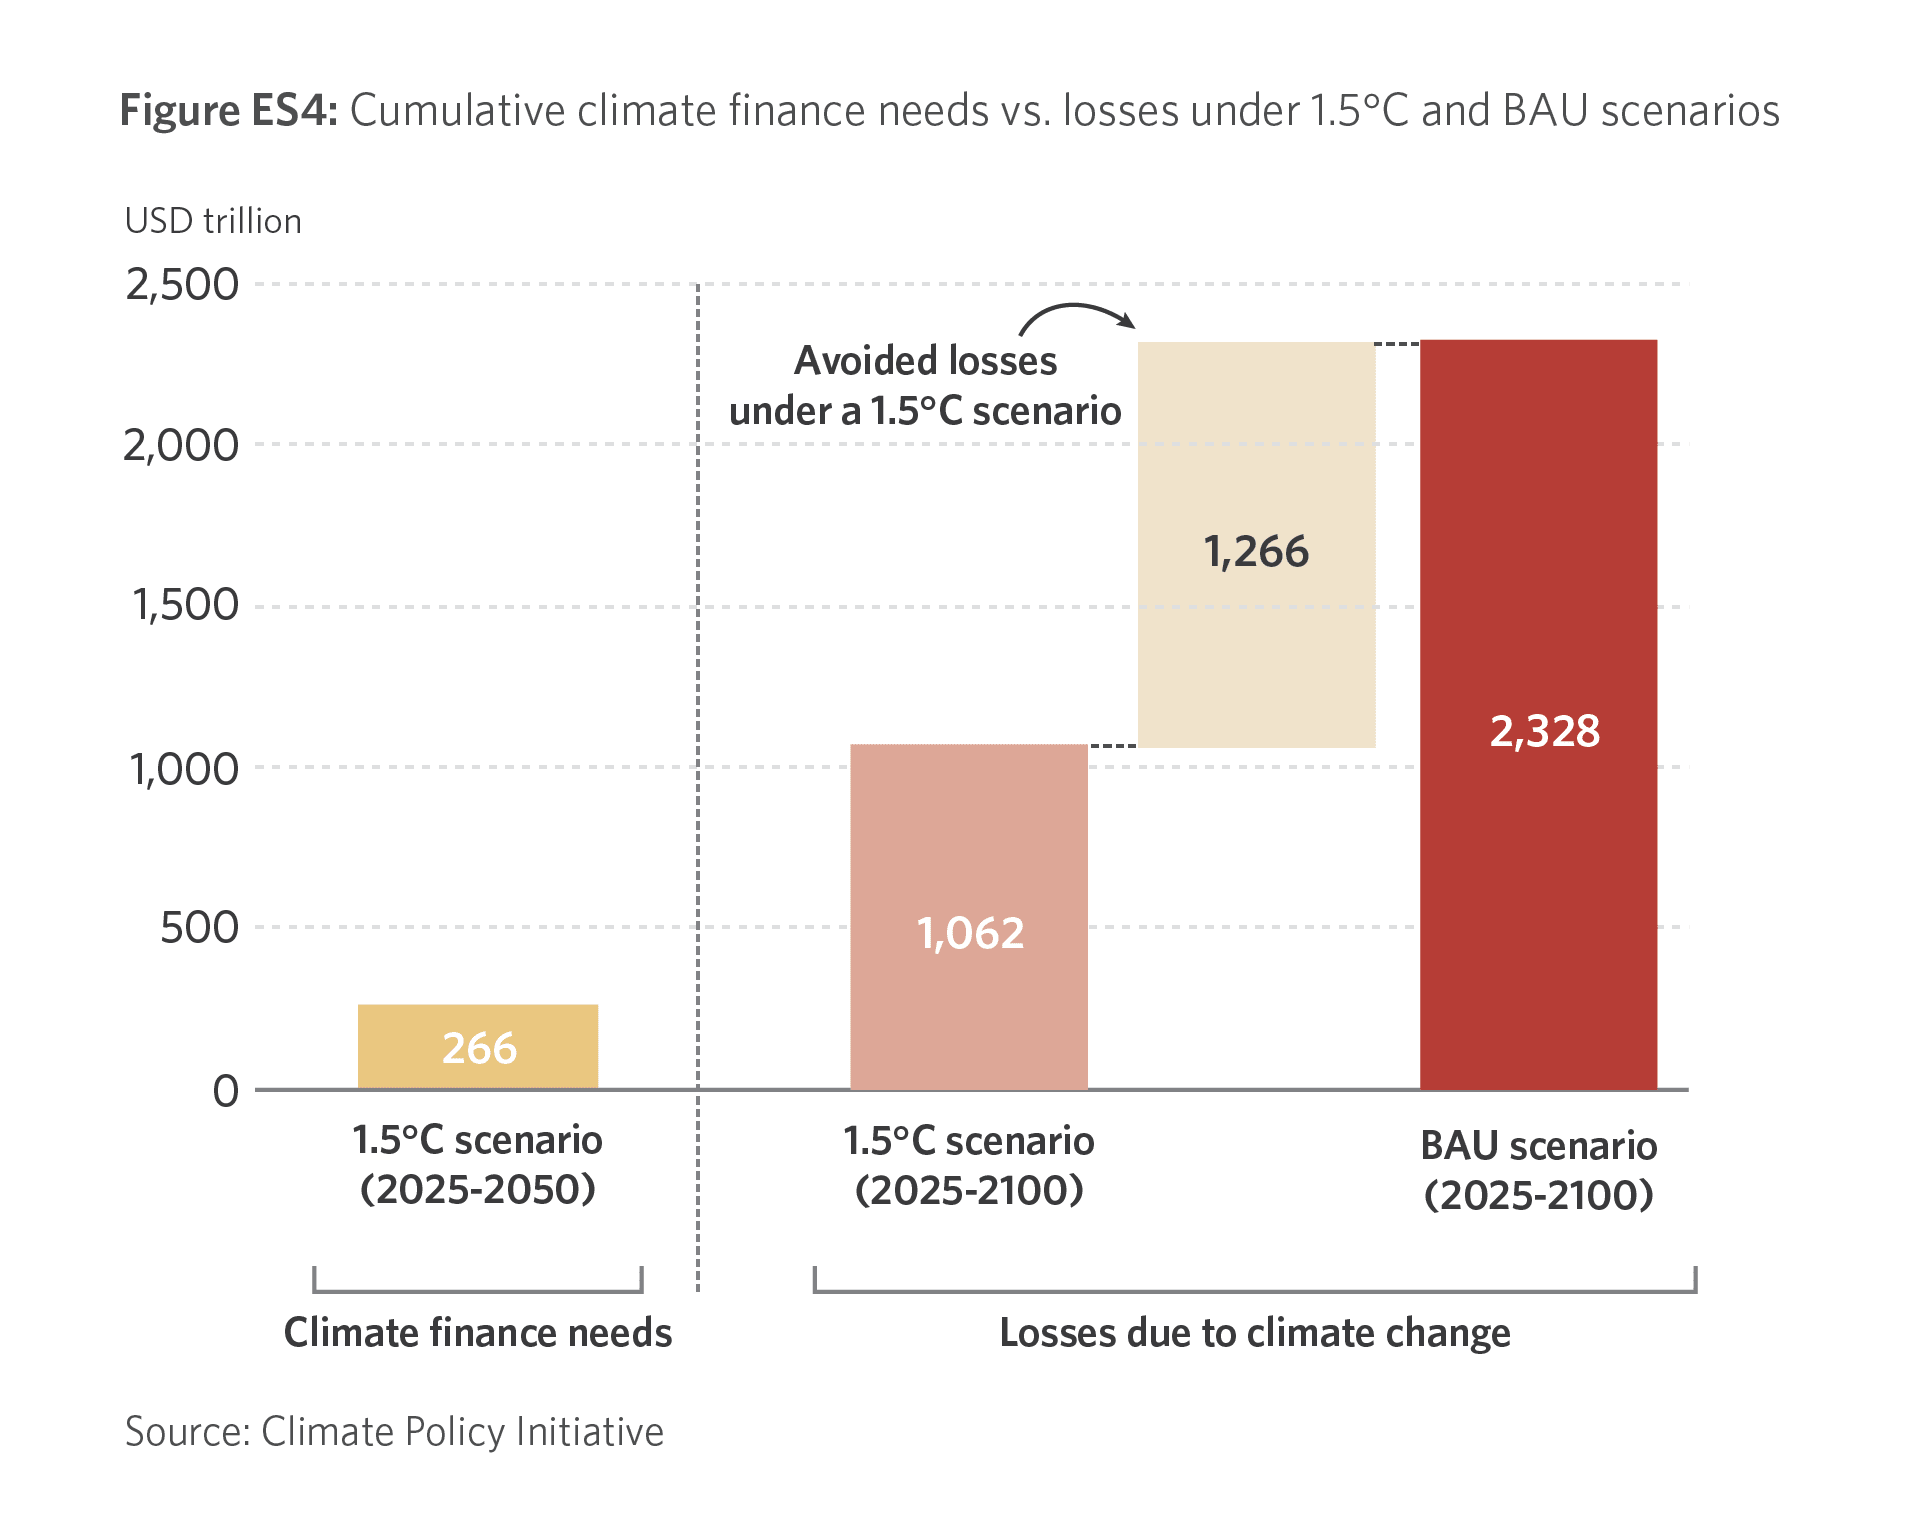
Although annual climate investment needs are large, the amount required is a fraction of the estimated losses likely to be incurred if we continue with business-as-usual (BAU) investments that cause global temperature increases well above 1.5°C.
Using numbers based on 95th percentile estimations of BAU and 1.5 damages scenarios, the estimated losses are based on direct economic impacts of increased weather-related and other uninsurable damages, increased production costs, productivity losses, and health costs (NGFS, 2022). These are likely to be a dramatic underestimate as they do not capture capital losses caused by stranded assets, losses to nature and biodiversity, or those from increased conflict and human migration that cannot yet be reasonably costed.
Even though data and methodology on estimating future losses are still rudimentary, they are forming a picture that clarifies the economic imperative to invest now, while also highlighting the immense opportunities for businesses to adopt increasingly low-carbon and climate- resilient pathways.
What does the data tell us?
We are making progress on increasing climate finance and on improving the sourcing of data to better understand it.
Climate finance is on the rise
Global climate finance approached USD 1.3 trillion on annual average in 2021/2022 compared to USD 653 billion in 2019/2020. Most of this growth is due to an increase in mitigation finance, with the largest growth in the renewable energy and transport sectors.
Climate finance data is also improving
A key function of the Global Landscape of Climate Finance (the Landscape) is to highlight where data gaps exist and how to improve them. This year’s Landscape reflects additional estimates on green bonds’ use of proceeds, which resulted in particularly improved coverage in three sectors: agriculture, forestry, other land use (AFOLU), and fisheries; buildings and infrastructure; and waste.
Approximately 28% (USD 173 billion) of the 2021/2022 increase is attributable to improved data.
However, growth is not sufficient nor consistent across sectors and regions
The growth in global climate finance largely results from significant increases in clean energy investment in a handful of geographies. China, the US, Europe, Brazil, Japan, and India received 90% of increased funds. While this marks promising progress, large climate finance gaps remain even in these geographies, and climate finance in other high-emissions and climate-vulnerable countries has shown meager progress in meeting their needs.
Climate finance is also uneven across sectors, for both mitigation and adaptation efforts. In terms of mitigation finance, which totaled 1.15 trillion in 2021/2022:
- Energy and transport, which are the two largest-emitting sectors and where private finance dominates, continue to attract the majority of flows: energy attracting 44% of total mitigation finance; transport receiving 29%). There was an exponential growth in the sale of electric vehicles (EVs) in 2021/2022 led by China, Western Europe, and the US.
- Agriculture and industry, the next-largest sources of emissions, receive disproportionately little (less than 4% of total mitigation and dual benefits finance). These two industries have a combined mitigation potential of 20 GTCO2 by 2030, higher than that of the energy and transport sectors according to the Intergovernmental Panel on Climate Change.
- Emerging technologies, such as battery storage and hydrogen, are beginning to attract private finance thanks to falling production costs, increased consumption, and policy support. However, they remain far from their potential scale.
Adaptation finance continues to lag
- While adaptation finance reached an all-time high of USD 63 billion, growing 28% from 2019/2020, this still falls far short of estimated needs of USD 212 billion per year by 2030 for developing countries alone.
- Tracked adaptation finance remains dominated by public actors (98%), with fragmented flows from the private sector. Adaptation finance tracking challenges continue to impede our understanding of progress of both public and private flows.
- AFOLU, a critical sector with considerable vulnerability and wide-ranging adaptation needs, received only USD 7 billion (11% of all adaptation finance).
Climate finance is geographically concentrated
Developed economies continued to mobilize the most climate finance, primarily from private sources.
- East Asia and the Pacific, the US and Canada, and Western Europe account for a combined 84% of total climate finance. These regions also significantly outpace others in mobilizing domestic sources, which are critical to achieving scale.
- China’s domestic climate finance mobilization was greater than that of all other countries combined, accounting for 51% of all domestic climate finance globally.
- International finance increased by 35% from 2019/2020, largely due to enhanced commitments from developed economies. Developed economies committed 84% of international finance, while emerging markets and developing economies (EMDEs), including China, committed 13%. South-South climate finance accounted for under 2% of total flows.
- Flows continued to fall short of needs, particularly in developing and low-income economies. Less than 3% of the global total (USD 30 billion) went to or within least developed countries (LDCs), while 15% went to or within EMDEs excluding China. The ten countries most affected by climate change between 2000 and 2019 received just USD 23 billion; 4 less than 2% of total climate finance.
Private finance is growing, but not at the rate and scale required
Private actors provided 49% of total climate finance (USD 625 billion). As with mobilizing domestic sources of finance, developed economies are much more successful at mobilizing private finance than EMDEs.
- The largest private sector growth came from household spending, which reached 31% of all private finance.
- This is the largest share that households have represented of private finance since CPI started its tracking over a decade ago. This was driven predominantly by EV sales, which doubled from 2020 to 2021. Such household spending growth was supported by strong domestic fiscal policies to support uptake of low-carbon technologies.
- Development finance institutions continue to provide the majority of public finance, channeling 57% of all public finance. However, more than 17% of public finance going to LDCs comes in the form of market-rate debt, increasing their already substantial debt burdens. In this context, renewed emphasis on the strategic use of public funds and other concessional finance to mobilize significantly more private capital is imperative.
How can we scale the quantity and quality of climate finance?
The context in which climate finance is being mobilized is evolving rapidly. Multiple ongoing crises vie for political and financial attention, while raising the cost of capital. Yet, the pressure to turn climate commitments into deployed climate finance, both public and private, is growing on all fronts.
CPI proposes the following priorities to accelerate climate finance deployment and create real economy impact:
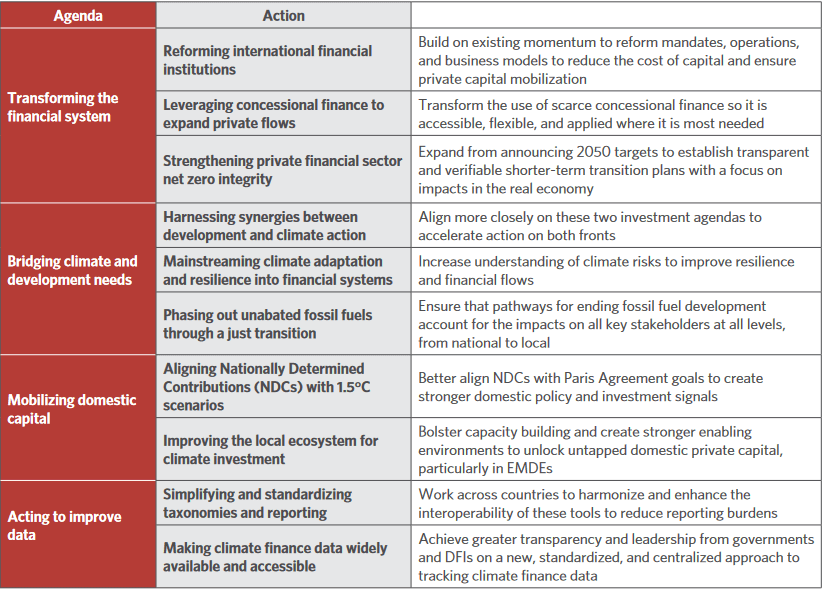
The above topics are discussed in detail in the Recommendations section of this report.
While pursuing low-carbon and climate-resilient development makes the most long-term economic sense, winning the public debate on its urgency and bringing along all groups is key to success. Revealing not only the effectiveness of climate investment to achieve the Paris Agreement goals, but also its necessity in reaching longer-term development, resilience, and security goals will help build the case for faster change.
