Family Farming in Brazil: Inequalities in Credit Access
The agriculture sector carries great economic and social relevance for Brazil, which is the fourth-largest food-producing country in the world.[1] Family farmers account for 75% of all rural properties in the country.[2] In addition to having fewer resources at their disposal and more restricted access to financial services, these producers are also the most vulnerable to climate change and increasingly frequent extreme weather events.[3],[4] Tailored public policies can contribute to making agriculture more modern and intensive, thus improving land use and reducing greenhouse gas emissions. It is, therefore, essential to understand how family farmers’ needs are met and seek ways to increase productivity and make natural resources management more efficient.
Brazil’s main agricultural policy is rural credit. Government expenses tied to credit subsidies are high: R$ 13.6 billion have been allocated to the 2023/2024 Brazilian Agricultural Plan, of which R$ 8.5 billion were designated exclusively to subsidize the National Plan for Family Farming (Programa Nacional de Fortalecimento da Agricultura Familiar – PRONAF).[5],[6] This sizeable investment should be used to benefit society in the form of productivity gains, technology adoption, and reduced deforestation. As the country prepares for a climate transition, it is key to understand who benefits from the rural credit policy and who still does not have access to it.
Agricultural policy must prioritize small producers to ensure that rural credit meets the needs of producers who face financial constraints in their attempts to modernize production and conserve native vegetation.[7] In this brief, researchers from Climate Policy Initiative/Pontifical Catholic University of Rio de Janeiro (CPI/PUC-Rio) reveal that access to credit for family farmers is both limited and unequal. Among family producers, credit is highly concentrated in larger properties, in the southern region, and in grain production.
Only 15% of family farmers get credit. Credit is taken out by 20% of producers whose properties span from 10 to 100 hectares, while this number drops to only 10% of producers whose properties are up to four hectares in size. Credit access also shows relevant geographic differences, as 29% of producers in the South access credit, while in the North only 9% of them do. Under PRONAF—the main line of credit for these producers—the average amount per hectare for contracts in the South (R$ 1,451) is eighteen times higher than in the North (R$ 83) of Brazil.
Resources are also concentrated when comparing different crops. Corn, wheat, and soy receive the most financing, with PRONAF credit accounting for more than 40% of the sales value of these products. In contrast, PRONAF accounts for less than 10% of the sales value of crops relevant to family farming, such as manioc, banana, sugarcane, cocoa, pineapple, orange, and açaí.
Given the disparities in access to credit among family farmers, public policy for these producers needs to consider differences in size, region, and product in order to expand the coverage of financial services to producers who are currently excluded. PRONAF must prioritize the most vulnerable regions and producers so that public policy can be effective in strengthening family farming, boosting economic development, ensuring food security, and promoting sustainability.
About PRONAF
PRONAF was created in 1995 to support family farmers. The objective of the program is to finance “working capital and investments in the implementation, expansion or modernization of the production, processing, industrialization, and services structure in rural establishments or in nearby rural community areas, aiming to generate income and improve the use of family labor.”[8]
According to the program’s current criteria, producers who carry out activities in rural areas are eligible for PRONAF if they meet the following requirements simultaneously: their area may not exceed four fiscal modules;[9] they must predominantly use the family’s own labor in the economic activities carried out in the establishment; at least 50% of the family’s gross income must come from economic activities carried out in the establishment; and their gross family income cannot exceed R$ 500,000.[10]
Financial resources are channeled via public and private banks at interest below market rates. PRONAF has fourteen different credit lines[11]—with interest rates between 0.5% and 6% and with individual contracts worth up to the maximum amount of R$ 420,000—directed towards crop and cattle farmers, fishermen, aquaculture farmers, foresters, and extraction workers.
Most rural credit operations are linked to PRONAF (Figure 1a). The number of PRONAF contracts amounted to R$ 1.4 million in 2022, equivalent to 73% of all rural credit contracts. However, PRONAF accounts for only 14% of the total volume of rural credit resources.[12],[13] This percentage indicates a lower level of financing compared to corporate farming (medium and large producers), as family farming accounts for 23% of all cultivated areas and for 23% of the production value.[14]
PRONAF’s percentages—i.e., 70-75% of the total number of contracts and 14-15% of the total volume of rural credit—remained stable between 2013 and 2022. However, looking only at credit with controlled resources, the number of PRONAF contracts increased from 72% to 82%, while the amount of program resources increased from 15% to 25% of the total (Figure 1b).[15] These differences are due to the credit increase from free resources, which mainly benefit corporate farming.
Furthermore, the 2023/2024 Brazilian Agricultural Plan allocates R$ 71.6 billion to PRONAF, which accounts for 16% of the total volume of rural credit, considering both family and corporate farming. Family farming is expected to receive R$ 8.5 billion in subsidies, which represents 62% of all the subsidies in the Brazilian Agricultural Plan.[16]
As such, this policy has steadily increased funding allocated to PRONAF in comparison to credit lines that target corporate farming. But it is paramount to look closely at PRONAF beneficiaries and at how the program serves family farmers. The next sections show important disparities in access to credit between family farmers in different dimensions.
Figure 1. Relevance of PRONAF in Rural Credit, 2013 and 2022
Note: In Figure 1b, credit operations with controlled resources are operations funded via the following sources: compulsory resources (MCR 6.2), Rural Savings (economic grants, weighting factor and conditions in MCR 6.2), equalizable BNDES/FINAME, FNO, FNE, FCO, LCA at a favorable rate, FUNCAFE, equalizable free resources, equalizable IHCD, additional requirements for compulsory resources and rural savings, compulsory for current account deposits (investment reinforcement), FAT, Land and Agrarian Reform Fund, National Treasury, state or municipal governments and funds, INCRA, PIS/PASEP and compulsory investment.
Source: CPI/PUC-Rio with data from SICOR/BCB, 2023
Fiscal Module
A fiscal module is a unit of area created by the National Institute of Colonization and Agrarian Reform (Instituto Nacional de Colonização e Reforma Agrária – INCRA) to determine, for each municipality, the minimum property size required to enable subsistence and social and economic progress for families that invest all their labor in agricultural activities.[17]
Fiscal modules were set by INCRA for each municipality back in the 1980s and to this day are used in Brazil as an eligibility criterion for rural credit lines such as PRONAF. To qualify for PRONAF, properties cannot exceed four fiscal modules. Despite significant advances in agricultural technologies and infrastructure in Brazil over the last few decades, leading to increased productivity in lands that previously were not very fertile, the definition of “fiscal module” has failed to incorporate such technological changes and has remained mainly unaltered since its creation. Because they are based on a productive distribution structure dating back more than 40 years, fiscal modules fail to reflect the country’s current productive reality, which may lead to distortions in access to credit.
Fiscal modules range from five to 110 hectares. Figure 2 highlights the significant disparities both among regions and among municipalities vis-à-vis the size of their respective fiscal modules. Coastal capitals and municipalities generally feature smaller fiscal modules, whereas areas such as the Cerrado biome have larger modules, corresponding to low productivity, even though this biome has experienced significant agricultural progress.
Furthermore, it is also common to have large disparities in classification between nearby municipalities, so that producers with the same amount of land may be categorized differently in terms of property size. This means a producer can be considered a family farmer in one municipality, while the same amount of land belonging to another producer in a neighboring municipality might be deemed as a medium or even as a large property. These distortions have a substantial impact on the profile of PRONAF beneficiaries and jeopardize its effectiveness as a support program for family farming in Brazil.
Figure 2. Size of Fiscal Modules by Municipality, 2018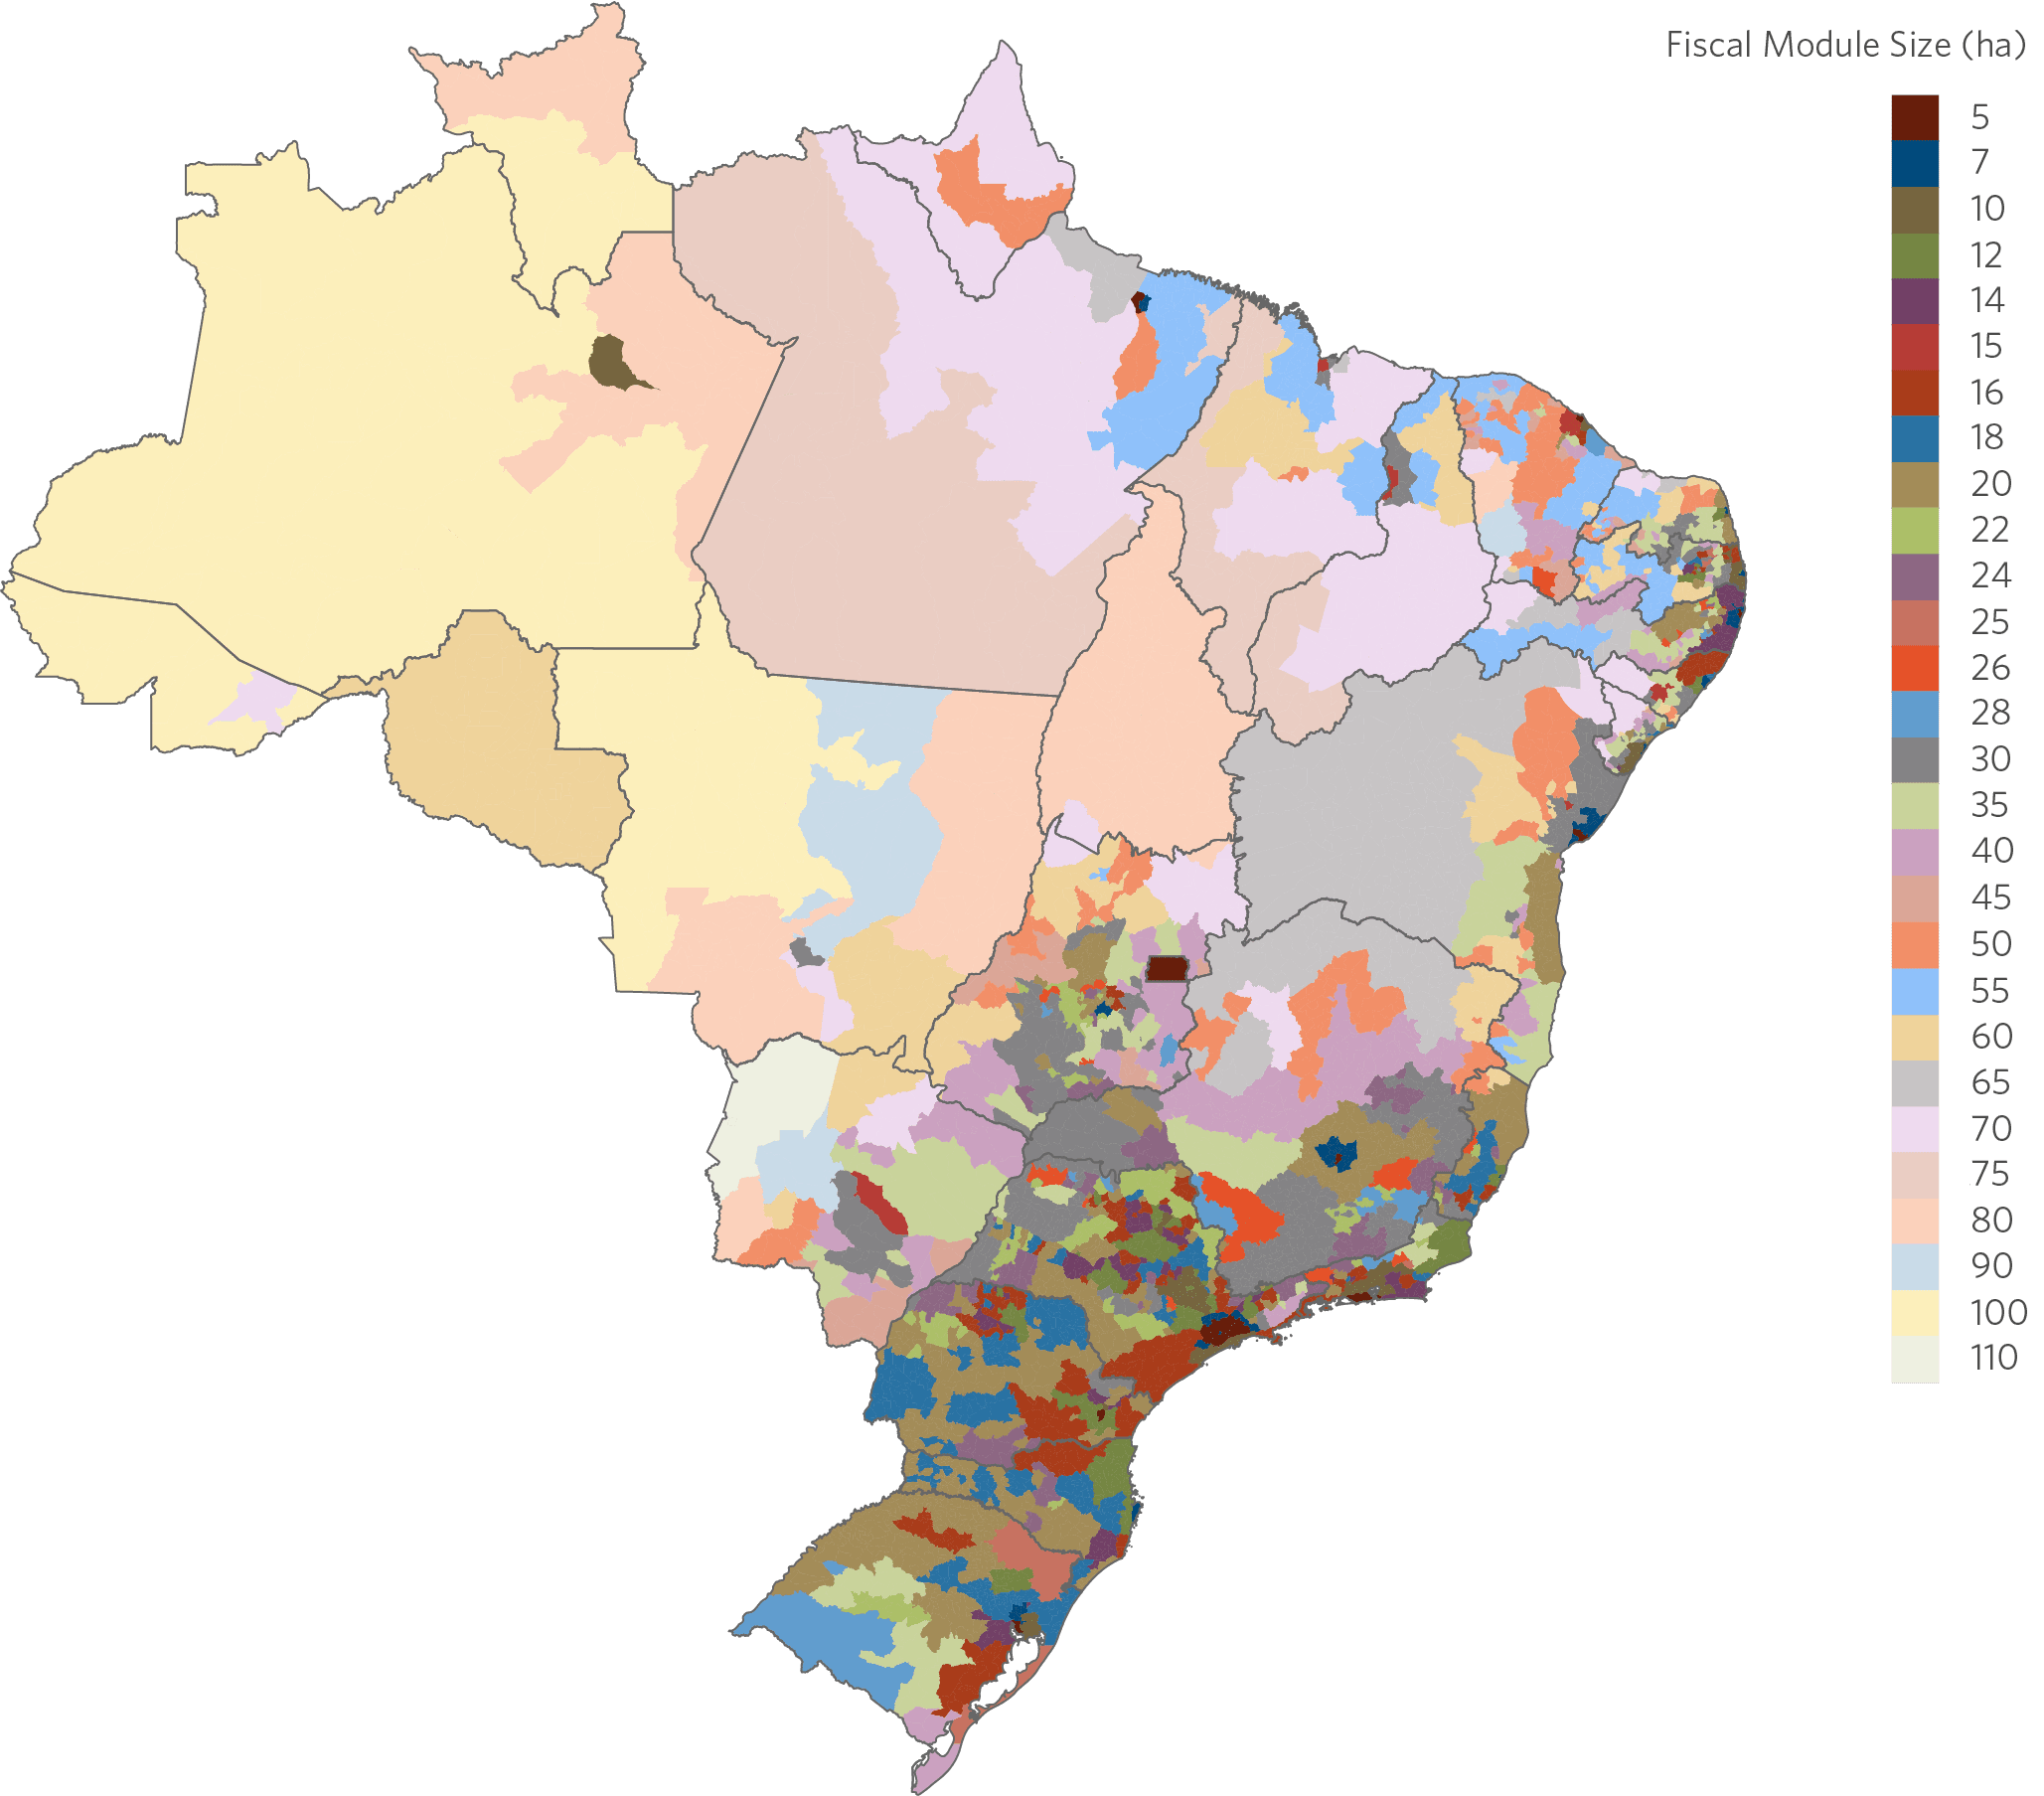
Source: CPI/PUC-Rio with 2020 data from the INCRA, 2020
Access to Credit by Family Farmers
Only 15% of family farmers access credit,[18] a similar figure to corporate farming (16%), according to data from the 2017 Agricultural Census. Around 1.3 million family producers have properties spanning between 10 and 50 hectares, which corresponds to 35% of all family farming (Figure 3). Of these producers, 20% report receiving some type of credit. At the 50 to 100 hectares level, 19% of producers obtain credit. Producers with smaller plots of land (between 0 and one hectare, and between one and four hectares) account for a significant number of establishments (1.3 million) and take the least amount of credit (8% and 11%, respectively).
Figure 3. Credit Access by Family Establishments by Farm Size, 2016
Source: CPI/PUC-Rio, with data from the 2017 Agricultural Census (IBGE), 2023
Figure 4 shows significant heterogeneity across the country’s regions. Access to credit is highest in the South, where 29% of family farmers access credit, in stark contrast to only 9% of producers in the North.
Figure 4. Credit Access by Rural Establishments by Type of Establishment and Region, 2016
Source: CPI/PUC-Rio with data from the 2017 Agricultural Census (IBGE), 2023
Figure 5 shows access to credit by farm size in each Brazilian region. Family farmers in the North have less access to credit: only 3% and 4% of producers who own between zero and one and one to four hectares in the region get credit, respectively. In contrast, among producers who own between zero and one and one to four hectares, those in the Northeast access credit the most: 8% and 12% of those producers, respectively. Finally, the South features the group of family producers that most access credit in the country: almost half (47%) of producers who own 50-100 hectares.
Figure 5. Access to Credit for Family Establishments by Size and Region, 2016
Source: CPI/PUC-Rio with data from the 2017 Agricultural Census (IBGE), 2023
Figure 6 reiterates the evidence of regional inequalities in PRONAF. In the case of working capital contracts, 60% of the number of contracts and 66% of the contract amounts in the country were in the South in 2022. This contrasts with 6% of contract amounts in the Midwest region and 7% of the amounts in both the North and Northeast regions. For investment contracts, 74% of the number of contracts in 2022 were in the Northeast. However, these contracts corresponded to 22% of the amount of the country’s operations, which reflects the low average amount in the Northeast compared to other regions. In contrast, while only 9% of the number of PRONAF investment contracts were in the South in 2022, these operations corresponded to 45% in terms of the country’s total amount, showing once again that this region receives a greater volume of PRONAF funding.
Figure 6. Distribution of Working Capital and Investment Contracts by Region, 2013-2022
6a. Distribution of Number of Contracts
Working Capital
Distribution of Number of Contracts
Investment Contracts
6b. Distribution of Total Amount
Working Capital
Distribution of Total Amount
Investment Contracts
Source: CPI/PUC-Rio with data from SICOR/BCB, 2023
Figure 7 shows the main products financed by PRONAF for working capital and investment purposes.[19] In working capital contracts, 33% of the financed amount is allocated to cattle and 26% to soy. Corn is the third most financed product at 15%, followed by coffee (6%), wheat (6%), and onion, rice, beans and grapes (at 1% each). In investment contracts, cattle farming (50%)[20] and machinery acquisition (24%) stand out.[21]
Figure 7. Value of PRONAF Operations by Credit Use and Product, 2013-2022
7a. Main Products of Working Capital
7b. Main Products of Investment Contracts
Source: CPI/PUC-Rio with data from SICOR/BCB, 2023
Figure 8 compares the share of the sales value of family farming that is financed[22] with the share of sales of corporate farming that is financed. At the national level, rural credit finances 21-22% of the value produced. The geographic discrepancy in access to credit is evident here, with 34% of the sales value in the South region being financed in both family and corporate farming, compared with lower financing in the other regions. Furthermore, there is a relevant difference in access to financing between family producers and medium and large producers. The biggest disparities can be found in the North and Northeast regions, where only 2% of the value of family farming is financed, versus 14-15% for corporate farming.
Figure 8. Share of Crop Sales Value that is Financed by Region, 2016
Note: The sales value of crops (excluding cattle) from family farming that qualified for PRONAF as defined in the 2017 Agricultural Census was considered here. Corporate farming encompasses all producers not eligible for PRONAF according to the definition in the Agricultural Census. As crops are only identified in working capital contracts, rural credit data correspond to such working capital contracts for crop-related activities identified by means of SICOR/BCB in 2016, which is the year of data collection for the 2017 Agricultural Census.
Source: CPI/PUC-Rio with data from SICOR/BCB (2016) and the 2017 Agricultural Census (IBGE), 2023
Figure 9a shows that the average amount of PRONAF contracts in the Midwest (R$ 49,140) is around nine times the average amount in the Northeast (R$ 5,383). Figure 9b, in turn, shows that PRONAF contracts in the South feature an average amount per hectare (R$ 1,451) four times higher than the Southeast (R$ 356) and eighteen times higher than the North (R$ 83).
Figure 9. Average Amount per Contract and per Hectare in PRONAF Operations by Region, 2016
9a. Average Value by Contract, 2013-2022
9b. Average Value by Hectare, 2016
Note: The graphs use the amounts for PRONAF working capital and investment contracts. Figure 9b shows the total amount of contracts divided by the agricultural area of establishments eligible for PRONAF according to the 2017 Agricultural Census. The contract amounts were obtained from SICOR/BCB for the year 2016, which is the year of data collection for the 2017 Agricultural Census.
Source: CPI/PUC-Rio with data from SICOR/BCB (2016) and the 2017 Agricultural Census (IBGE), 2023
Figure 10 shows the PRONAF allocation per hectare at the state level. It also reveals that the states in the South receive relatively more resources than other regions. The states in the North, in turn, have fewer resources relative to agricultural area.
Figure 10. Average Amount of PRONAF Operations per Hectare, 2016
Note: The graph is based on the amount of PRONAF working capital and investment contracts for the year 2016 (at December 2022 prices). The agricultural area of establishments eligible for PRONAF was considered here, in accordance with the Agricultural Census 2017. The contract amounts were obtained from SICOR/BCB for the year 2016, which is the year of data collection for the 2017 Agricultural Census.
Source: CPI/PUC-Rio with data from SICOR/BCB (2016) and the 2017 Agricultural Census (IBGE), 2023
Figure 11 shows that soy is the main family farming crop in Brazil, accounting for 25% of the total sales value, followed by tobacco (16%), coffee (14%), corn (8%), manioc (5%), banana (5%), grapes (3%), sugarcane (2%), rice (2%), cocoa (2%) and beans (2%). Figure 12 shows the main crops produced by family farming in each region. Soy production stands out in the Midwest and South, accounting for 52% and 38% of total production in these regions, respectively. Furthermore, production is concentrated in just a handful of products in those two regions. In the Midwest, the three main crops (soy, corn and manioc) account for more than 80% of all production. In the Northeast and North, however, production is distributed across a greater number of crops, with emphasis on cocoa, manioc, açaí, and banana.
Figure 11. Distribution of the Sales Value of Family Farming Products, 2016
Note: The sales value of crops (excluding cattle) from family farming that qualified for PRONAF as defined in the 2017 Agricultural Census was considered.
Source: CPI/PUC-Rio with data from the 2017 Agricultural Census (IBGE), 2023
Figure 12. Distribution of the Sales Value of Family Farming Products by Region, 2016
North
Northeast
Midwest
Southeast
South
Note: The sales value of crops (excluding cattle) from family farming that qualified for PRONAF as defined in the 2017 Agricultural Census was considered.
Source: CPI/PUC-Rio with data from the 2017 Agricultural Census (IBGE), 2023
The comparison between the sales value and the amount of PRONAF funds allocated to each crop sheds light on how different products are financed.[23] Figure 13a shows the sales value and the value financed by PRONAF for the main family farming products. Figure 13b shows the sales value of corporate farming and the value financed with funds from the Brazilian Agricultural Plan. When comparing these two figures, it is important to note that both the total sales value and the total credit for corporate farming are much higher than for family farming. For soy, for example, the sales value of corporate farming (R$ 120.0 billion) is twelve times greater than that of family farming (R$ 9.4 billion).
Corn and wheat stand out as crops for which more than half of the value is financed in family farming, with 89% and 77% of the value financed, respectively. In the case of soy production—the third most financed crop and the main product of both family and corporate farming—family farmers receive relatively more resources than corporate farming, with 41% of the sales value financed compared to only 14% in corporate farming.
Figure 13. Sales Value Financed per Product, 2016
Note: Rural credit data only considers working capital contracts, as these are the only ones where the crops involved are identified. Cattle was not included in the analysis due to a lack of sales value data for cattle in the Agricultural Census.
Source: CPI/PUC-Rio with data from SICOR/BCB (2016) and the 2017 Agricultural Census (IBGE), 2023
Discussion
Family farmers constitute the majority of rural properties in Brazil. These producers face financial constraints that make them more vulnerable, in addition to making modernization, the adoption of new and sustainable technologies, and productivity increases harder to achieve. This study shows that only 15% of family farmers access credit. Additionally, rural credit for family farming—which relies on government subsidies—is concentrated in the South, among larger establishments, and among grain producers.
Public funds must be allocated efficiently for the benefit of society. Previous studies by CPI/PUC-Rio show that offering credit to small producers changes their production decisions, leading to better land use and intensification and also to less deforestation.[24] Therefore, in addition to improving the targeting of rural credit resources towards family farming, it is necessary to consider the heterogeneity of these producers and prioritize those who face greater credit restrictions.
In this context, PRONAF eligibility criteria need to be revised so that credit can have a greater impact on reducing vulnerabilities, improving land use, and reducing deforestation. Gains can clearly be obtained from revising the fiscal modules—which are currently four decades out of date—so that they once again match Brazil’s current productive reality.
Finally, given the current challenges of reducing deforestation and the climate crisis, policy must provide incentives for the transition to low-carbon agriculture. As such, the adoption of sustainability criteria for obtaining financing, as well as restrictions for producers with embargoes and for those who deforest must be incorporated into credit rules. PRONAF credit lines linked to the ABC+ Plan[25]—such as PRONAF Agroecology and PRONAF Bioeconomy—should also be reinforced. Thus, the policy will effectively contribute to promoting economic development and food security, as well as mitigation and adaptation to climate change.
The authors would like to thank Wagner Oliveira, Marcos Duarte, Rogério de Mello, and Juliano Assunção for research assistance. We would also like to thank Natalie Hoover El Rashidy, Giovanna de Miranda, and Camila Calado for the editing and revision of the text and Nina Oswald Vieira for formatting and graphic design.
[1] According to data from the Food and Agriculture Organization (FAO) for 2021. Learn more at: FAOSTAT. Value of Agricultural Production. 2021. Access date: October 6, 2023. bit.ly/3rvRBLK.
[2] IBGE. Censo Agropecuário 2017. 2017. Access date: September 1, 2023. bit.ly/3PywErm.
[3] De Albuquerque, Amanda, Pablo Castro, and Juliano Assunção. What is the Climate Risk for Rural Producers in the Caatinga? Challenges for a Rural Just Transition. Rio de Janeiro: Climate Policy Initiative, 2023. bit.ly/ClimateRiskCaatinga.
[4] Tanure, Tarik M. P., Edson Paulo Domingues, and Aline S. Magalhães. “Regional impacts of climate change on agricultural productivity: evidence on large-scale and family farming in Brazil”. Revista de Economia e Sociologia Rural 62, no. 1 (2023). bit.ly/3LTBj6j.
[5] On December 30, 2022, the exchange rate was USD$ 1, which is equivalent to R$ 5.22.
[6] Learn more at: Walendorff, Rafael. Custo total para a equalização do Plano Safra 2023/24 será de R$ 13,6 bi. Globo Rural. 2023. Access date: September 1, 2023. bit.ly/3PNYlg6.
[7] Assunção, Juliano and Priscila Souza. The Impacts of Rural Credit on Agricultural Outcomes and Land Use: an Analysis by Credit Lines, Producer Types and Credit Uses. Rio de Janeiro: Climate Policy Initiative, 2020. bit.ly/3QsLmSd.
[8] BNDES. Pronaf – Programa Nacional de Fortalecimento da Agricultura Familiar. nd. Access date: September 1, 2023. bit.ly/3F2hJRf.
[9] See the definition of fiscal module in the Box below.
[10] BCB. Manual de Crédito Rural, MCR Normas, Programa Nacional de Fortalecimento da Agricultura Familiar (PRONAF), section 2. Access date: October 6, 2023. bit.ly/48F5V59.
[11] PRONAF credit lines include: PRONAF A, Costing, More Food, Agroindustry, Forest, Semi-Arid, Women, Youth, Industrialization of Family Agroindustry, Share Quotas, Group “B”, Agroecology, Bioeconomy and Guided Production. Learn more at: BCB. Manual de Crédito Rural, MCR Normas, Programa Nacional de Fortalecimento da Agricultura Familiar (PRONAF), sections 4 to 7. Access date: October 6, 2023. bit.ly/48F5V59.
[12] BCB. Matriz de Dados do Crédito Rural – MDCR – v2. 2022. Access date: September 27, 2023. bit.ly/484xhS5.
[13] The analyses in this text use calendar years to make rural credit data compatible with the Brazilian Institute of Geography and Statistics (Instituto Brasileiro de Geografia e Estatística – IBGE) databases.
[14] BCB. Matriz de Dados do Crédito Rural – MDCR – v2. 2022. Access date: September 27, 2023. bit.ly/484xhS5.
[15] This growth trend in the PRONAF share can also be seen if we consider only the operations financed with controlled resources in which at least part of the credit is subsidized by public funds. In this case, the percentage for the number of contracts rises from 82.4% to 86.4% between 2013 and 2022; in terms of amounts, the proportion goes from 21.5% to 31.5%. This calculation is based on complementary microdata from the Rural Credit and PROAGRO Operations System (Sistema de Operações do Crédito Rural e do Proagro – SICOR) made available by the Central Bank of Brazil (Banco Central do Brasil – BCB). Learn more at: BCB. Tabelas e Microdados do Crédito Rural e do PROAGRO. nd. Access date: September 1, 2023.
bit.ly/45aK02V.
[16] The 2023/2024 Brazilian Agricultural Plan establishes R$ 5.1 billion in subsidies for corporate farming. The total subsidies for family farmers and medium and large producers in the 2023/2024 agricultural year are R$ 13.6 billion. Learn more at: Walendorff, Rafael. Custo total para a equalização do Plano Safra 2023/24 será de R$ 13,6 bi. Globo Rural. 2023. Access date: September 1, 2023. bit.ly/3PNYlg6.
[17] EMBRAPA. Módulos Fiscais. nd. Access date: September 1, 2023. bit.ly/3Te0OAI.
[18] To analyze PRONAF data from the Central Bank of Brazil (Banco Central do Brasil – BCB) compatible with data from the Agricultural Census, “family farming” was considered as the sum of the “ PRONAF V” and “ PRONAF B” categories in the Census data. As such, the analyses focus on the potential target audience, where eligibility is based on the definition of family farming as laid out in Law no. 11,326/2006, along with the inclusion of the annual family income threshold. According to this law, classification as a farmer or family business requires compliance with all the following requirements: (i) the land owned in any capacity must not exceed four fiscal modules; (ii) the family’s own labor must be predominantly used in the economic activities carried out in the family’s establishment or enterprise; (iii) a minimum percentage of the family’s income must originate from the economic activities carried out in the family’s establishment or enterprise, as defined by the Brazilian Executive Branch in Law no. 12,512/2011; (iv) the establishment or enterprise must be managed by the family. The other eligibility criterion is having an annual family income of less than R$ 360,000 during the Census period. Due to the unavailability of eligibility data for Group A/C in the Census, this category has not been included among the establishments suitable for family farming and eligible for PRONAF. Learn more at: Law no. 11,326, July 24, 2006 – Establishes the guidelines for formulating the National Policy for Family Farming and Rural Family Enterprises. bit.ly/48BvBQ8.
Law no. 12,512, October 14, 2011 – Establishes the Environmental Conservation Support Program and the Rural Productive Activities Promotion Program; amends Laws nos. 10,696, of July 2, 2003, 10,836, of January 9, 2004, and 11,326, of July 24, 2006. bit.ly/3ryASHz.
[19] PRONAF has four distinct credit uses: working capital, investment, trade, and industrialization. However, 98% of the total amount financed between 2013 and 2022 was geared toward working capital and investment.
[20] The following SICOR categories were added to cattle farming: “cattle”, “terraces, gates, cattle grids, corrals, troughs, fences”, “sheep”, “pasture”, “goats”, “pigs”, “facilities for poultry, pigs and rabbits”, “poultry farming”, “poultry farms”, “other animals”, “bee boxes, combs, centrifuges used for honey extraction, smokers”, “pig farms”, “mules”, “acquisition of traceability systems for cattle and buffaloes”, “equines”, “buffaloes”, “artificial insemination”, “donkeys”, “sirgarias”, “wild animals”, “acquisition of semen, ova and embryos from animals”.
[21] The following SICOR categories were added to machinery acquisition: “machines and implements”, “trailers, carts and wagons for freight, forage and other purposes”, “other machinery”, “equipment and utensils for precision agriculture”, “acquisition of engines and lifts”, “renovations of machines, apparatus, equipment and vehicles, purchase of parts and accessories”, “machines, apparatus and instruments”, “cultivator”, “harvesters, pickers and pluckers”, “equipment installation/assembly/transport”, “acquisition of heaters, generators, incinerators, compressors, fans, and air conditioning units”, “acquisition of computer and telecommunications equipment, including software”, “motorized cultivators”, “tractor”, “biodigester, manure pit, biological oxidation tanks and water and sewage treatment”, “acquisition of topographic equipment(s)”, “bases for scales”, “acquisition of forklift(s)/tipper(s)”, “animal scale”, “unmanned aerial vehicle (drone)”.
[22] The sales value of crop products was considered. Cattle were not included due to a lack of sales value data in the Agricultural Census. Only the working capital credit values were considered for financing, as these operations allow for the identification of individual crops, as shown in Figure 6.
[23] To this end, the sales value in the 2017 Agricultural Census is compared to the amount of PRONAF costing contracts allocated in 2016. Costing contracts identify the crop to which the funds are geared.
[24] Assunção, Juliano and Priscila Souza. The impacts of rural credit on agricultural outcomes and land use: an analysis by credit lines, producer types and credit uses. Rio de Janeiro: Climate Policy Initiative, 2020. bit.ly/3QsLmSd.
[25] The ABC+ Plan is the Plan for Adaptation and Low Carbon Emission in Agriculture (2020-2030) prepared by Ministry of Agriculture and Livestock (Ministério da Agricultura e Pecuária – MAPA). Learn more at: bit.ly/3tOlLun.
